Denoising
Let’s see if linear model can be improved by performing some denoising of the sensor signals.
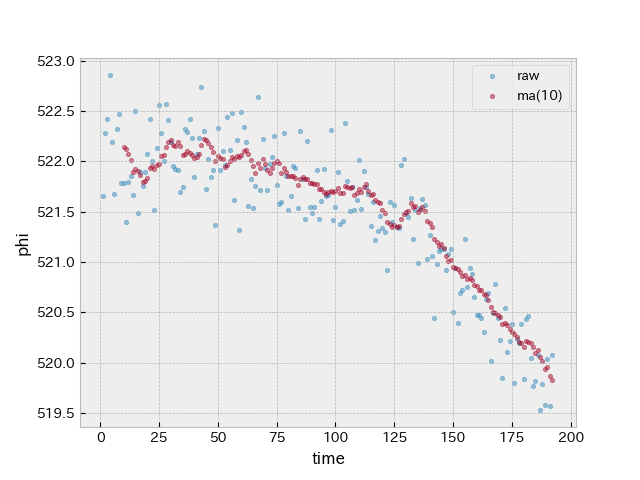
The above plot shows raw sensor readings in blue and moving average of the last 10 sensor readings in red. One can clearly see that the sensor readings are more stable after applying the moving average on the sensor readings.
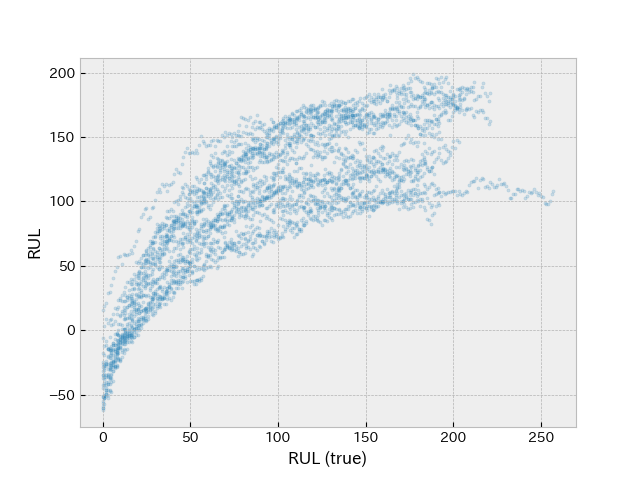
The above plot shows true RUL versus predicted RUL using linear model on the sensor readings with moving average applied.
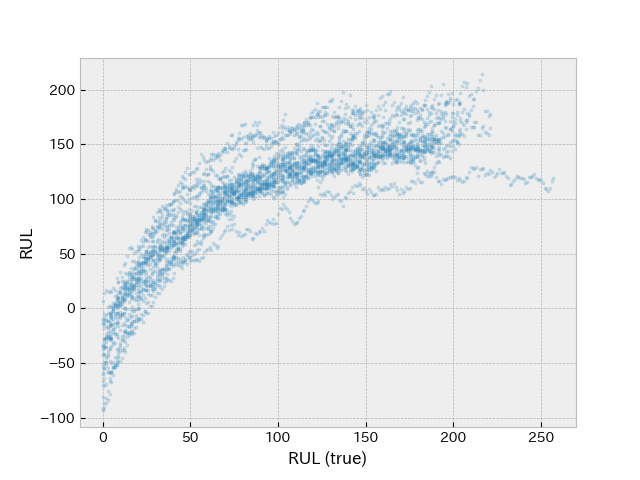
The above plot shows true RUL versus predicted RUL using linear model on the sensor readings with moving average applied as well as feature engineered data.
      raw       ma(10)  fe      ma(10)+fe
==========================================================================
MSE   1581.6    1430.4  1190.8  1057.7
R2    0.5799    0.5875  0.6837  0.6950
score inf       inf     inf     inf
The fit results of the linear model have been improved by denoising sensor readings with moving average.